|
|
|
 V. ECONOMIC SECTOR V. ECONOMIC SECTOR
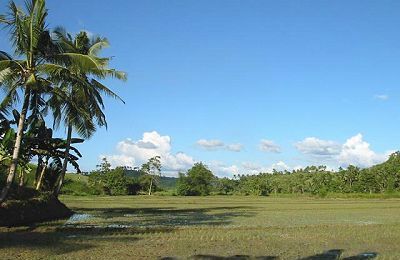
This
agricultural riceland in Brgy. Quezon, San Jorge,
Samar is frequently flooded for almost 40 years now. Once
considered rice granary in
Samar, massive logging during
the 60's and continued kaingin at present have caused this perennial
flood problem which brought agricultural losses estimated at P180 million a
year.
A. Agriculture
A1. Area
The province has a total land
area of 559,100 hectares. Of this, 140,529 hectares or 25.13 percent is
agricultural land.
The potential irrigable land of the province of Samar is
15,782 hectares. The total irrigated area is merely 2,327 hectares, which is only
about 15 percent of the total potential irrigable area.
As an agricultural province, the
Bureau of Agricultural Statistics (BAS-Samar) identified the following highly
produced crops in 2012 as major: Coconut, banana, palay, corn, cassava, camote,
gabi and pineapple. Ubi, one of the rootcrops grown in the province could also
be considered, but it is a seasonal crop and only a little portion of farm lot
is devoted to it. Almost all of the agricultural cops mentioned showed an
increased production from 2010-2012.
Status of Irrigation Development
(2008)
|
|
Area (Ha.) |
|
Potential irrigable area |
|
15,782 |
|
Communal |
1,908 |
|
|
OGA |
48 |
|
|
Private |
371 |
|
|
Total Irrigated |
2,327 |
|
|
Area
for development |
|
13,455 |
|
%
Developed / Irrigated area |
|
15% |
A2. Palay
Palay production (see Table below)
showed a positive trend from 2008-2012. An increase of 32.70 percent was noted
within the 5-year period, from 105,896 metric tons in 2008 to 140,529 metric
tons in 2012. Likewise, its harvested area was increased from 46,694 hectares to
54,698 hectares and registered an average yield of 2.27-2.57 metric tons per
hectare.
From 2008-2012, palay posted a
total production of 622,995 metric tons which averaged at 124,599 metric tons
annually. Rainfed is always placed at more than 80 percent of the total palay
production and rest for irrigated and upland.
Comparative Palay and Corn
Production (2008-2012)
|
Type of
Crop |
2008 |
2009 |
2010 |
2011 |
2012 |
|
Palay |
|
|
|
|
|
|
Production (M.T.) |
105,896 |
114,168 |
124,084 |
138,318 |
140,529 |
|
Irrigated |
16,284 |
16,956 |
15,841 |
17,232 |
17,372 |
|
Rainfed |
89,612 |
97,212 |
108,243 |
118,478 |
119,802 |
|
Upland |
- |
- |
- |
2,608 |
3,355 |
|
Area Harvested (Ha.) |
46,694 |
47,201 |
49,385 |
54,336 |
54,698 |
|
Irrigated |
4,658 |
4,743 |
4,742 |
5,101 |
5,134 |
|
Rainfed |
42,036 |
42,458 |
44,643 |
47,213 |
47,147 |
|
Upland |
- |
- |
- |
2,022 |
2,417 |
|
Average Yield (M.T./Ha.) |
2.27 |
2.42 |
2.51 |
2.55 |
2.57 |
|
Irrigated |
3.50 |
3.57 |
3.34 |
3.38 |
3.38 |
|
Rainfed |
2.13 |
2.29 |
2.42 |
2.51 |
2.54 |
|
Upland |
- |
- |
- |
1.29 |
1.39 |
|
Corn |
|
|
|
|
|
|
Production |
7,227 |
8,318 |
9,129 |
9,198 |
9,133 |
|
Area Harvested |
5,431 |
6,070 |
6,432 |
6,647 |
6,656 |
|
Average Yield |
1.33 |
1.37 |
1.42 |
1.38 |
1.37 |
A3. Crop Production
|
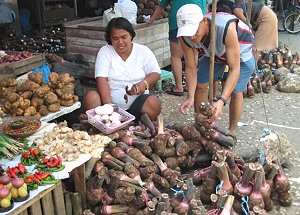
A rootcrop vendor at the
Catbalogan market |
Ninety percent (90%) of the
population of the province of Samar
is dependent on rice for their food intake; hence it is staple food of the
Samareños. In the year 2000, total palay production under the Agrikulturang
MakaMASA program, registered at 40,579.48 metric tons, of which 9,751.74
metric tons came from irrigated fields; 29,110 metric tons, rainfed/lowlands;
and 1,717.74 metric tons, uplands. The decrease in production for this year
could be attributed to the occurrence of rat infestation in the entire province
and typhoon damage reported which occurred in October 2000.
The total area harvested for the same year (2000)
was 16,516.86 hectares. Of this total, 3,102.45 hectares or 18.78% was
irrigated; 12,173.66 hectares or 73.70% rainfed; and, 1,240.75 hectares or
7.51%, upland.
Total corn production (white) recorded at 613.09
metric tons (MakaMASA Report 2000) and its average yield for this year
registered at 1.61 metric tons/hectare. Comparing the average yield for 1999
and 2000, the decrease in production to 59% could be attributed to unsuitable
weather.
Vegetable production was very minimal. The province
was only able to produce 29.2 metric tons of various vegetables for the year
2000.
Selected root crops such as cassava, sweet
potato, gabi and ubi registered a total production of 16,073 metric tons.
Cassava represents 45.36% of the total production with an average yield of 1.27
metric tons/hectare.
|
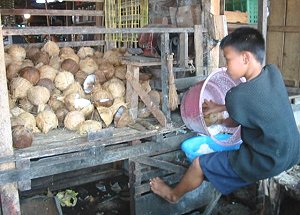
Coconut is still the main
commercial crop of the province. Here, a young boy is extracting a coco
meat using an electric motor. |
The Bureau of Agricultural Statistics (BAS) also
reported a banana production of 31,301.3 metric tons in an area harvested at 4,817 hectares with an average yield of 6.498 metric tons/hectare. This
performance could be attributed to the campaign of commercialization and the
adoption of farmers of desuckering method.
Coconut is the main commercial crop in the province, which
are mostly concentrated in coastal areas. Total coconut area for the year
2000 was 563,670 hectares. The total number of coconut trees was 10,099,
872 of which 7,322, 525 (72.5%) are bearing trees and 2,777,347 (27.5%) are
non-bearing trees. The total coconut production was 270,360,381 nuts with
an average yield of 37 nuts/tree/year and its equivalent copra production was
57,290 metric tons. It recorded a remarkable increase of 58.08% from its
1999 production.
For CY 2004,
there was only a slight growth (1.56%) in palay production, which totaled 66,114
metric tons, from 65,097 metric tons in 2003. Corn production as of CY 2003,
recorded a total of 4,546 metric tons and was up by 5.52% or 4,797 metric tons
in 2004.
Likewise,
total production in vegetables (leafy and fruit) for the year exceeded the total
production of 2003 (487.50 MT) by 22.27%, equivalent to 596.09 metric tons, of
which 93.74% came from fruit vegetables (see table below).
|
Type of Crop |
2004 |
2003 |
Harvested Area
(Ha.) |
Production
(MT) |
Harvested Area
(Ha.) |
Production
(MT) |
Rice
Irrigated
Rainfed |
40,031.00
4,112.00
35,919.00 |
66,114.00
9,896.00
56,218.00 |
40,027.00
4,101.00
35,926.00 |
65,097.00
9,754.00
55,373.00 |
| Corn
(White) |
5,343.00 |
4,797.00 |
5,347.00 |
4,546.00 |
Vegetables
Fruit
Leafy |
166.00
146.00
20.00 |
596.09
558.79
37.30 |
108.00
88.00
20.00 |
487.50
437.92
49.58 |
Rootcrops
Cassava
Sweet Potato
Gabi
Ubi |
9,210.00
4,739.00
4,014.00
433.00
24.00 |
16,871.94
7,709.03
5,030.70
4,085.37
46.84 |
9,199.00
4,734.00
4,009.00
432.00
24.00 |
16,528.79
7,542.45
4,913.03
4,027.84
45.47 |
| Fruit (Banana) |
3,833.00 |
103,860.50 |
3,833.00 |
108,380.35 |
Root crops on
the other hand rose production to 16,871.94 metric tons in 2004 or 2.08% higher
than the previous year. Cassava is still the leading root crop for the year.
Banana fruit,
which could be seen in the market all year round has lowered its production by
4.17% from 108,380.35 metric tons in the year 2003 down to 103,860.50 metric
tons in 2004.
Palay
production data with intervention (see table below) includes the use of hybrid
and certified seeds together with the use of organic and inorganic fertilizers,
while the without intervention includes the use of only good seeds with or
without fertilizers.
Data on the
tables below showed a significant difference in the average yields for palay
production using hybrid and certified seeds plus the application of organic and
inorganic fertilizers compared with palay production using only good seeds.
|
With
Intervention Palay Production under the GMA-Rice Program |
|
Type |
November 2003 - April
2004 Cropping |
May to October 2004
Cropping |
|
AH |
Prod. |
Ave. Yield |
AH |
Prod. |
Ave. Yield |
| Irrigated |
242.75 |
914.31 |
3.80 |
309.50 |
1,052.45 |
3.40 |
| Rainfed |
238.50 |
782.46 |
3.28 |
506.81 |
1,649.06 |
3.25 |
| Hybrid |
74.13 |
395.05 |
5.32 |
69.20 |
358.94 |
5.19 |
|
Total |
555.38 |
2,091.82 |
3.77 |
885.51 |
3,060.45 |
3.46 |
| |
|
Without
Intervention Palay Production under the GMA-Rice Program |
|
Type |
November 2003 - April
2004 Cropping |
May to October 2004
Cropping |
|
AH |
Prod. |
Ave. Yield |
AH |
Prod. |
Ave. Yield |
| Irrigated |
960.70 |
3,271.11 |
3.40 |
863.75 |
2,591.25 |
3.00 |
| Rainfed |
4,389.34 |
12,090.58 |
2.75 |
3,972.94 |
10,664.03 |
2.68 |
| Upland |
117.00 |
290.00 |
2.48 |
551.33 |
984.10 |
1.80 |
|
Total |
5,467.04 |
15,651.69 |
2.86 |
5,388.02 |
14,239.38 |
2.64 |
A.3 Livestock and Poultry
Chicken, as of
2004 recorded the highest meat consumed in the province, which comprised 80% of
the total heads slaughtered in abattoir and dressing plant. This was due to
price increase of other meats sold in the market.
|
Type of Meat |
2004 |
2003 |
|
(Head) |
(MT) |
|
Carabeef |
1,517 |
617.80 |
|
Beef |
150 |
116.10 |
|
Pork |
86,417 |
1,989.20 |
|
Chicken Meat |
349,577 |
436.80 |
A.4 Breeding Stations
The province has three (3)
Artificial Breeding Centers, maintained by the Office of the Provincial
Agriculturist (OPA) located at San Agustin, Gandara; Tominamos, Sta. Rita; and,
OPA Compound, Catbalogan; and one outreach station in Basey. The centers
conduct artificial insemination services to upgrade the native animal stocks.
In the year 2000 the three boars maintained in OPA Compound had produced 40
heads of offspring through artificial insemination.
Moreover, private hog raisers through AI services
rendered by the center chiefs produced 197 heads of offspring. There were also
192 heads of carabaos that were artificially inseminated and were able to
produce 82 heads of calves that genetically improved calf drop. Weaned calves
and piglets dispersed to qualified farmers and 4-H Club members in support to
the establishment of income-generating projects.
The province has two field facilities: the R.T.
Diaz Freshwater Hatchery in San Agustin, Gandara; and, Mussel Farm in Jiabong.
The fingerlings (tilapia and carp) and mussels produced were dispersed to fish
farmers and mussel farm beneficiaries.
B. Commerce and Industry
B.1 Labor, Industry and Marketing
Based on the 2000 DTI Report,
the province posted a total investment of P168.405799M, which was 51.5 percent
higher than its target. Likewise, the province's export of $13.546907M was
almost doubled from its annual target.
A total of 7,258 employment was generated for the year.
It was in the Aqua Marine Products (1,760) and CARP Programs (1,426) that
recorded the highest number of employment.
The total number of registered establishments in 1996 was
2,274, with trading (wholesale and retail trade) having the most number of 1,258
establishments.
In 2004,
industries such as gift, toys & house wares (GTH), trading, manufacturing, food
processing and agro-production generated a total investment of P32.93256 M and
395 employment as a result of various assistance extended to new and identified
clients.
The focus of
assistance to Small and Medium Enterprises (SMEs) were on areas of improving
access to financing particularly the food processors through financial
facilitation with Quedancor and other foreign sources.
With regards
to Business Regulation, DTI office has reflected 993 Business Name (BN)
registered firms wherein 713 are original and 280 renewals.
| Major
Industries: |
a.)
Integrated Mussel Industry (Jiabong) |
| |
b.) Coco Oil
Industry (Calbayog) |
| |
c.) Tinapa
Industry (Calbayog) |
| |
d.) Native
Cheese Processing (Gandara) |
| |
e.) Abaca
Industry |
| |
f.) Ticog
Industry (Basey) |
| |
g.) Fishing
Industry |
| |
h.) Copra
Industry |
B.2 Financial Institutions
There are ten (10) banks
operating in the province with nine (9) branches based in Catbalogan. Some
rural banks are also operating in various municipalities of the province. It
offers loans and other services aside from the regular savings deposits.
|
Name
of Banks |
Locations |
| 1.
Allied Bank |
Catbalogan |
| 2.
China Banking Corporation |
Catbalogan |
| 3.
Development Bank of the Phil. |
Catbalogan |
| 4.
Land Bank of the Phil. |
Catbalogan, Calbayog City |
| 5.
MetroBank |
Catbalogan, Calbayog City |
| 6.
PCI-Equitable Bank |
Catbalogan |
| 7.
Philippine National Bank |
Catbalogan, Calbayog City |
| 8.
RCBC |
Catbalogan, Calbayog City |
| 9.
Rural Bank |
Calbayog City, Basey, Calbiga, Gandara, Sta.
Margarita |
| 10.
United Coconut Planters Bank |
Calbayog City |
|