|
|
|
 VIII. SOCIAL SERVICES VIII. SOCIAL SERVICES
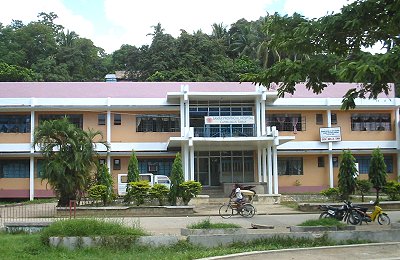
The
newly renovated Samar provincial Hospital.
A. Education
A.1 Schools
The Department of
Education, Culture and Sports (DECS), Division of Samar has under its direct
supervision 688 public elementary schools in 27 school districts and 53 public
secondary schools. For Calbayog City Division, it has under its supervision 157
elementary schools in seven (7) districts and nine (9) secondary schools.
State-administered secondary level training is available from a vocational
school the Wright Vocational School; 3 agricultural schools: Samar National
Agricultural School (SNAS), West Coast Agricultural School, Basey National
Agricultural School (BNAS); 2 Fishery Schools, the Samar Regional Institute of
Fishery and Clarencio Calagos Memorial School of Fisheries; and, 2 State
Colleges, the Samar State University and Tiburcio Tancinco Memorial
Institute of Science and Technology.
A. 2 Enrollment
The
Samar State University is the only university in the province |
As of school year
2000-2001, DECS, Samar Division recorded a total of 87,691 enrollees for public
elementary schools, of which 65,780 pupils were primary grades and 21,911
pupils were intermediate grades. For the public secondary schools it recorded a
total of 23,449 enrollees.
On the other
hand, cohort survival rate in the elementary level for SY 1998-1999 and SY
2000-2001 were 72.12 percent and 75.03 percent, respectively. This indicates
that there was an increasing number of grade one pupils who actually reached
sixth grade. For the secondary level, the cohort survival rate for SY 2000-2001
was 64.67 percent. This was 16.63 percent lower than in SY 1999-2000, which
indicates that there was a decline in the number of first year students who
reached fourth year.
Retention rate
of 90.05 percent for the elementary level in SY 2000-2001 was 4.22 percent lower
than in SY 1999-2000. This indicates that there was a decrease in the
elementary pupils who are in school. For the secondary level, the retention
rate for SY 1999-2000 and SY 2000-2001 were 83.95 percent and 83.29 percent,
respectively. There was a slight decrease (0.66%) in the number of secondary
students who are in school.
Table
7. Enrollment by Level the Last Three School Year
|
Level of Education |
SY 1998-1999 |
SY 1999-2000 |
SY 2000-2001 |
|
Primary |
64,892
|
64,983
|
65,780
|
|
Intermediate |
20,415
|
21,626
|
21,911
|
|
Secondary |
20,901
|
22,331
|
23,449
|
There was a
slight decrease in the drop-out rate from 1.70 percent for SY 1998-1999 down to
1.50 percent for SY 2000-2001, for the elementary level. As for the secondary
level there was also a decrease from 9.78 percent to 9.58 percent for SY 1998-1999 and SY
2000-2001 respectively.
A.3 Performance Indicator
The participation rate for
the elementary level in SY 1999-2000 to SY 2000-2001 was maintained at 98.39
percent. In the secondary level, participation rate of 97.05 percent was also
maintained for SY 1999-2000 to SY 2000-2001. However, this is 1.62 percent
higher compared to SY 1998-1999, which was 95.43 percent.
A.4 Teacher-Pupil Ratio
For SY 2000-2001, the
teacher-pupil ratio in the elementary level was 1:31 and in the secondary level
for the same school year was 1:33. The Samar Division still lacks about 400
teachers and 250 teachers for elementary and secondary levels to meet the
standard ratio 1:25 for elementary and secondary levels.
A.5 Physical Facilities
The total number of
elementary school buildings for SY 2000-2001 was 1,404 with a total of 3,155
rooms. While in the secondary it has a total of 175 school buildings and 478
classrooms. The Samar Division still lacks more buildings for the elementary
and secondary levels to meet ratio of 1 room per 25 pupils/students.
A.6 Textbook Ratio
For SY 2000-2001, the
textbook-pupil ratio was 1:3 (one set of textbooks per three pupils). For the
textbook-student ratio it was 1:4 (one set of textbooks per four students).
This ratio is very much below the standard ratio of 1:1.
B. Health and Nutrition
B.1 Health Facilities
|
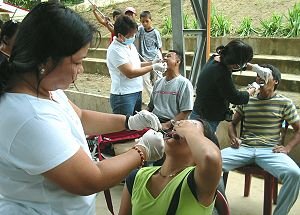
Medical and Dental missions are regularly held in various municipalities. |
The province of Samar has
one Provincial Hospital with a 100-bed capacity, 3 districts hospitals, (one
with a 75-bed capacity, the other 2 with 25-bed capacity), and a municipal hospital with 10-bed capacity,
for a total of 5 government hospitals and a 235-bed total capacity. The
hospital bed ratio is 1:2,514 population. There are also 30 Rural Health Units
located in poblacions with a 1:21,371 population ratio. There are also 105
barangay health stations manned by a midwife providing services to a cluster
barangays whose ratio is 1:6,106 population (see table below).
A nurse and a midwife were
assigned to the island town of Almagro to assist the health problems of its
inhabitants wherein its community hospital was no longer in operation due to
lack of funds and a physician. The provincial and district hospitals are the
central referral centers of the clustered Rural Health Units (RHU) and Barangay
Health Stations (BHS).
|
Facility |
Description / Bed Capacity |
Total |
| Public Hospitals |
Samar Provincial
Hospital (100 beds)
Calbayog District Hospital (75 beds)
Gandara District Hospital (25 beds)
Basey District Hospital (25 beds)
Tarangnan Municipal Hospital (10 beds) |
235 Hospital Beds |
| Private
Hospitals |
Calbayog
Sanitarium Hospital (15 beds)
St. Camillus Hospital (60 beds) |
75 Hospital Beds |
| Rural
Health Units |
Main
Health Center in the poblacion |
30 |
| Barangay
Health Stations |
Health
Center in the barangay manned
by a midwife providing services to cluster
barangays. |
105 |
B.2 Health Manpower
The number of
medical/health personnel has been inadequate compared to the demand of the
increasing population every year and the absence of some medical equipments in
almost all hospitals in the province of Samar. As a result, there is a big
manpower population ratio. For the city of Catbalogan alone, the hospital
manpower ratio is 1:419 (419 persons for every 1 medical/health hospital
worker).
|
Manpower |
Field |
Hospital |
Total |
|
Physician |
21 |
29 |
50 |
|
Nurse |
32 |
75 |
107 |
|
MIdwife |
119 |
- |
119 |
|
Dentist |
9 |
5 |
14 |
|
Dental Aide |
8 |
3 |
11 |
|
Medical Technologist |
6 |
6 |
12 |
|
Nutritionist Dietician |
1 |
5 |
6 |
|
Pharmacist |
- |
6 |
6 |
|
Engineer (Sanitary) |
1 |
- |
1 |
|
Radiologic Technologist |
- |
5 |
5 |
|
Health Educator & Promo. Officer |
2 |
- |
2 |
|
Sanitation Inspector |
32 |
- |
32 |
|
Medical Lab. Technician |
1 |
1 |
2 |
|
Laboratory Technician |
- |
2 |
2 |
|
Laboratory Aide |
- |
4 |
4 |
|
Social Welfare Officer |
2 |
- |
2 |
|
Nursing Attendant |
- |
52 |
52 |
|
Cook |
- |
8 |
8 |
|
Barangay Health Workers |
2,999 |
- |
2,999 |
|
Trained Birth Attendants |
547 |
- |
547 |
|
Total |
3,780 |
201 |
3,981 |
There are 50
government-employed physicians, 21 which are municipal health officers.
The physician-to-population ratio was 1:10,685; 107 nurses (32 are public health
nurses), 1:5,009; 119 midwives, 1:4,714; 14 dentists, 1:45,795; 32 sanitary
inspectors, 1:14,247; 12 medical technologists (6 are field medical
technologists), 1:53,427; 6 nutritionists, 1:106,854; 6 pharmacists, 1:106,854
and 1 sanitary engineer, 1:641,124 population.
B.3 Health Statistics
The total births in year
2000 were 11,826, which were higher than in 1999, recorded at 11,754. The
rate of 23.33/100,000 population within the 2-year period was the same.
Of the total
births (11,826) 89 percent (10,505) were delivered at home attended by field
midwives, nurses or trained hilots. The reported deaths have increased from 1,461 in 1999 to 1,518 in 2000, and the rate also increased from 2.94 in 1999 to
3.00/100,000 population in 2000.
The two leading causes of
infant mortality were pneumonia (41) and diarrhea (16) with rate of 3.63 and
1.43 per 1,000 live births respectively. These were also the two leading
causes of infant mortality in the past five years.
For maternal mortality,
its three leading causes for the same year (2000) were placenta retention at
2.00 per 1,000 live births, hypertension in pregnancy (0.41), and hemorrhage
secondary to abortion (0.2).
The two leading causes of
mortality were pneumonia (223) and cardiovascular diseases (201).
Pneumonia (9,624) was still the leading cause of morbidity for the same year
(2000) followed with diarrhea (8,012) and the third was bronchitis (4,336).
Table 8. Ten Leading Causes
of Mortality (all causes) CY 2000
|
Causes |
Number |
Rate |
|
1. Pneumonia |
223 |
44 |
|
2. Cardiovascular disease |
201 |
40 |
|
3. PTB |
134 |
26 |
|
4. Hypertension |
84 |
17 |
|
5. Cancer |
77 |
15 |
|
6. Diarrhea |
57 |
11 |
|
7. Senility |
57 |
11 |
|
8. Coronary artery |
49 |
10 |
|
9. Accidents |
44 |
9 |
| 10.
Stab Wounds |
36 |
8 |
In 1995, out
of the 13,261 eligible children, 78.25 percent were fully immunized, and for
measles was 78.49 percent. For tetanus toxoid, the eligible population was 15,073 with 48.96 percent immunized. In 1997, fully immunized children were 86.33
percent and for tetanus toxoid it was 53.65 percent.
B.4 Nutrition Statistics
In 1995, the
prevalence rate for Protein Energy Malnutrition (PEM) was 24 percent or 24 out
of 100 preschoolers. Vitamin A Deficiency (VAD) among preschoolers (1-4 years
old) was 8.1 percent and for Iron Deficiency Anemia was 18.6 percent. In 1995,
22 percent or 22 out of 100 school children are suffering from Protein Energy
Malnutrition (PEM). Iodine Deficiency Disorder (IDD) is 27.7 percent among school
children specifically grades I and II wherein almost one third (1/3) were found
to have goiter.
Among pregnant mothers in
1995, 30 percent were high-risk pregnancy associated with malnutrition.
Three out of ten or 30 percent of the 15-40 years old women have goiter.
In 1993, the prevalence rate of anemia among pregnant women was 17.9 percent;
likewise, the problem was evident among lactating mothers. In 1995, 4.4
percent of 0-11 months infants were found to be suffering from malnutrition and
24 percent were low birth weight infants.
The 9-11 months old
children eligible population was 14,318 and about 66.02 percent or 9,453 was
given vitamin A supplement. Among the 12-59 months old children, 58,894
(100.03%) were given vitamin A supplement. For postpartum mothers, 8,286
or 57.87 percent were also given vitamin A supplement. Among pregnant
women 58.27 percent or 9,736 out of 16,707 eligible population were given
complete Iron dosage. Among the 15-40 years old women, 52,144 (52.81%) out
of 98,745 eligible women were given iodine supplement.
In 2004, the
22,394 (29.5%) pre-school children weighed were found to be under normal weight
(low and very low) which was slightly greater than in 2003 (28.9%). Likewise,
those in the above normal weight increased by 1.9% from 3,160 (4.3%) in 2003 to
4,684 (6.2%) pre-schoolers in 2004. The normal weight children remained below
50% share of the total weighed children within the two year period (see table
below).
|
Nutritional Status Report for Pre-school Children (0-72 Months old) |
|
Status |
2004 |
2003 |
|
No. of Children |
No. |
Percent |
No. |
Percent |
|
93,417 |
|
91,720 |
|
| Total
No. of Children Weighed |
75,942 |
81.3 |
73,705 |
80.4 |
|
Normal |
48,864 |
64.3 |
49,189 |
66.7 |
|
Above Normal |
4,684 |
6.2 |
3,160 |
4.3 |
|
Below Normal (Low) |
18,964 |
25.0 |
17,504 |
23.7 |
|
Below Normal (Very Low) |
3,430 |
4.5 |
3,865 |
5.2 |
In the elementary level, below
normal body weight shared 21.58% of the total pupils weighed (60,898), in which
the Grade 1 pupils registered the highest number. Above normal weight totaled
3,545 pupils (5.82%), while 44,209 or 72.6% represent the normal weight pupils
(refer to table below).
|
Nutritional Status report for Elementary School Children (SY 2004-2005) |
|
Grade Level |
Enrolment |
Pupils Weighed |
Weight / Body Mass
Index |
|
Below Normal |
Normal |
Above Normal |
|
Pre-Elem. |
639 |
639 |
85 |
520 |
34 |
|
I |
13,031 |
12,932 |
3,556 |
8,861 |
515 |
|
II |
11,084 |
11,001 |
2,529 |
7,797 |
675 |
|
III |
10,421 |
10,296 |
2,402 |
7,392 |
502 |
|
IV |
9,408 |
9,368 |
1,733 |
7,046 |
589 |
|
V |
8,355 |
8,306 |
1,505 |
6,180 |
621 |
|
VI |
7,983 |
7,922 |
1,260 |
6,102 |
560 |
|
SPED |
434 |
434 |
74 |
311 |
49 |
|
Total |
61,355 |
60,898 |
13,144 |
44,209 |
3,545 |
Reports on Family Planning
Program (see table below) have shown reduction in the Contraceptive Prevalence
Rate (CPR) especially the pill, which has been the most preferred method by most
women (19,155 in 2003 down to 5,671 in 2004) for current and continuing users.
This could be attributed to the insufficient and irregular supply of
contraceptive, non-implementation of modern NFP method. Non-working mothers
prefer Lactational Amelorrhea Method (LAM) especially in rural areas. Support
from NGOs and private organizations have contributed in making FP services
accessible.
|
Family
Planning Method of Preference |
|
Method of Preference |
New Acceptors |
Current / Continuing
Users |
|
2004 |
2003 |
2004 |
2003 |
|
Pill |
1,577 |
1,864 |
5,671 |
19,155 |
|
Condom |
224 |
344 |
368 |
1,511 |
|
Female Sterilization |
146 |
19 |
440 |
385 |
|
IUD |
28 |
65 |
164 |
509 |
|
Injection |
532 |
630 |
830 |
3,894 |
|
Male Sterilization |
2 |
1 |
24 |
126 |
|
Natural Family Planning |
120 |
241 |
102 |
1,177 |
|
Lactational Amelorrhea Method (LAM) |
2,883 |
2,708 |
2,679 |
5,530 |
|
Total |
5,614 |
5,872 |
9,278 |
32,287 |
Households
with sanitary toilets have reached to 59.19%, a minimal increase of 2.66% from
CY 2002 (see table below). The support from NGOs and LGUs in the construction of
water and sanitary facilities were instrumental in achieving the goal of the
program. However, this is still a big health problem in which these households
resort to other means of waste disposal that may cause diseases.
|
Status of
Households with Sanitary Toilet |
|
Municipality |
Total Household |
HHs
with Sanitary Toilet (2002) |
Sanitary Toilet Construction (2003) |
Existing Toilets (2003) |
Percent (%) |
|
Basey District |
|
|
|
|
|
|
1. Basey |
7,301 |
5,743 |
73 |
5,816 |
79.66 |
|
2. Marabut |
2,051 |
788 |
69 |
857 |
41.78 |
|
3. Sta. Rita |
5,020 |
3,294 |
11 |
3,305 |
65.83 |
|
Gandara District |
|
|
|
|
|
|
1. Gandara |
4,811 |
1,906 |
212 |
2,118 |
44.02 |
|
2. Matuguinao |
895 |
541 |
21 |
562 |
62.79 |
|
3. Pagsanghan |
1,498 |
1,172 |
47 |
1,219 |
81.37 |
|
4. San Jorge |
2,229 |
694 |
795 |
1,489 |
66.80 |
|
Calbayog District |
|
|
|
|
|
|
1. Almagro |
1,770 |
896 |
- |
896 |
50.62 |
|
2. Sta. Margarita |
3,623 |
2,343 |
137 |
2,480 |
68.15 |
|
3. Sto. Niño |
2,091 |
1,256 |
- |
1,256 |
60.06 |
|
4. Tagapul-an |
1,395 |
689 |
8 |
697 |
49.97 |
|
Catbalogan District |
|
|
|
|
|
|
1. Calbiga |
3,148 |
2,462 |
- |
2,462 |
78.21 |
|
2. Catbalogan |
14,030 |
8,966 |
155 |
9,121 |
65.01 |
|
3. Daram |
5,922 |
2,018 |
160 |
2,178 |
36.78 |
|
4. Jiabong |
2,566 |
979 |
- |
979 |
38.15 |
|
5. Hinabangan |
2,020 |
1,178 |
70 |
1,248 |
61.78 |
|
6. Motiong |
2,191 |
803 |
66 |
869 |
39.66 |
|
7. Paranas |
4,654 |
3,704 |
341 |
4,045 |
86.91 |
|
8. Pinabacdao |
2,195 |
1,295 |
- |
1,295 |
58.99 |
|
9. San Jose de Buan |
1,073 |
779 |
- |
779 |
72.60 |
| 10.
San Sebastian |
1,130 |
779 |
15 |
794 |
70.26 |
| 11.
Talalora |
1,097 |
496 |
23 |
519 |
47.31 |
| 12.
Tarangnan |
3,423 |
1,340 |
75 |
1,415 |
41.33 |
| 13.
Villareal |
5,509 |
1,811 |
28 |
1,839 |
33.38 |
| 14.
Zumarraga |
2,570 |
1,589 |
20 |
1,609 |
62.61 |
|
Total |
84,212 |
47,521 |
2,326 |
49,847 |
59.18 |
C. Housing
C.1 Number
The province has a total
of 100,484 occupied housing units in 1990 for 102,038 households giving a ratio
at 1.015 households per housing unit. The ratio for 531,903 household
population per housing units was 5.293.
C.2 Type, Condition and
Year Built
Large proportions of the
housing units built of cogon, nipa or anahaw both for roofing (75.77%) and for
outer walls (55.10%). However, the proportion of housing units that do not need
repair, or if at all a minor one only is relatively high at 64.34 percent. On
the other hand, majority (67.69%) of the housing units was built after 1980 and
mostly of the occupied housing units (97.76%) were single houses.
C.3 Occupancy
About 56.08 percent of the
total occupied housing units were with 4 to 7 occupants. About 98.67 percent of
the total occupied housing units were with one household.
C.4 Ownership
Of the 102,038 households
in the province, 90.0 percent own their housing units, 46.1 percent of that also
own the lot where the unit is constructed. Among those who own their housing
units, 96.6 percent constructed their houses from their own resources; 0.4
percent with funds from government financing schemes; and, 2.4 percent through
private persons.
C.5 Floor Area
Census results show that
three-fourths of the housing units (74.1 percent) in Samar are with limited
floor area of less than 30 square meters. About 17.6 percent measure 30-69
square meters, while 8.4 percent are spacious units (70 square meters and over).
C.6 Low-Cost Projects
Listed below are some of the low-cost housing projects in Catbalogan. Some
of these projects have already started while some others are still in the
planning process.
|
Name
of Subdivision |
Area
/ No. of units |
Location |
Remarks |
| V&G Subdivision/GSIS |
30 has / 300 |
Sitio Sto. Niño,
San Andres, Catbalogan, Samar |
Socialized housing |
| Goldenville Subdivision |
3.9 has / 121 |
Brgy. Maulong, Catbalogan, Samar |
Socialized housing |
| Villa Christina |
13 has/ 503 Econ, 384 Social |
Brgy. Socorro, Catbalogan, Samar |
Socialized housing |
| D and E Realty |
19 has / 412, 1 commercial |
Km. 2, Catbalogan |
Socialized housing |
| Loreta Heights |
2.4 has / 194 |
Brgy. Pupua, Catbalogan, Samar |
Socialized housing |
| Catbalogan City Homes |
11 has / 600 |
Brgy. Tagbaya-on, Jiabong, Samar |
Socialized housing |
| Piczonville Subdivision |
20 has / 420 |
Brgy. Guinsorongan, Catbalogan, Samar |
Socialized housing |
D. Public Safety
D.1 Crime Rate
Crime volume as of 2000
recorded a total of 697. Most of the crimes committed were those crimes versus
persons that may constitute 90 percent of the total cases. The crime solution
efficiency rate for the period was 98.8 percent.
D.2 Population- Policeman
Ratio
The province, as of 2000
has a total strength of 700 policemen. From 1997, twenty-four (24) policemen
have been added for the year 2000. Population-policeman ratio was 1:916.
D.3 Population- Fireman
Ratio
In the year 2000, there
was an additional of 20 firemen in the province of Samar, which totaled 129.
This number reduced the population- fireman ratio of 1:5,407 in 1997 to 1:4,970
in the year 2000.
E. Social Welfare
E.1 Services and
Clienteles
About 34,648 households
(30 percent) out of the 115,493 total number of households in 1995 in the
province are in need of the basic social services.
In 1995, there were about
176,811 persons in the province or about 30 percent of the total population, who
are in difficult situation.
E.2 Indigent Groups
In 1995, there were about
57,290 persons in the province or 9.72 percent of the total population that
belong to the indigent groups.
E.3 Handicaps
In 1995, there were about
7,886 persons in the province or about 1.3 percent of the total population, who
were reported to have some type of disability. The sex ratio of the population
with some type of disability was 111 males per 100 females. Low vision was the
most common type of disability in 1995 accounting for 21.62 percent of all
persons with disability. The percentage with low vision was higher among the
female population (26.35%) than among the male population (17.36%). Partial
Blindness was the second most common type of disability (12.86%), followed by
partial deafness (10.65%), and paralysis of one or both legs (6.49%).
E.4 Assistance Center
The Provincial Social
Welfare and Development Office maintains one Crisis Intervention Unit in its
office in Catbalogan.
F. Sports and Recreation
For sports and recreation,
the province has a provincial stadium, which consists of a track oval, a
complementary grandstand and a spectator's gallery. It also has a provincial
gymnasium. These are all located in Catbalogan.
|