|
|
|
VII. MACROECONOMIC SECTOR
A. Income and Expenditures
The estimated income of
the province for CY 2000 was P397,263,588.00. This amount was appropriated
to the following: Personal Services, P183,241,589.00 (46%); Maintenance and
Other Operating Expenses, P59,268,596,00 (15%); Capital Outlay, P8,997,000.00
(2%); and, Statutory/Contractual Obligations and Budgetary Requirements,
P145,756,403.00 (37%).
Sectoral distribution of
appropriation were as follows: General Services, P122,705,996.35 (31%); Economic
Services, P123,388,749.65 (31%); and, Social Services, P151,168,842.00 (38%).
The province realized an
actual income amounting to P374,526,560.25. Of this figure 98.86 percent
or P370,266,478.34 was derived from the Tax Revenue and only 1.14 percent or
P4,260,181.91 from the Operating and Miscellaneous Revenue. The Internal
Revenue Allotment (IRA) was the major source of Tax Revenue in the amount of
P367,258,492.00 or 98.06 percent of the total actual income. The actual
income was 5.72 percent lower than the estimated income. On the other
hand, actual expenditures amounted to P364,259,842.39 and it is higher compared
to the 1999 figure, which incurred some P305,824,607.52 or an increase of
P58,435,234.87 (19.11%). This could be attributed to the provision of
additional benefits and compensation to the provincial employees, which
increased the personal services and capital outlay.
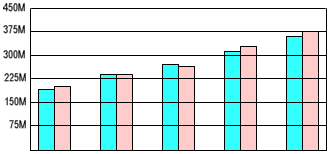
Figure 1.
1996-2000 Actual Revenue and Expenditure (Province of Samar)
1996
1997 1998
1999 2000
█ Expenditure
█ Revenue
For the
five-year period, from 1996-2000, the province of Samar derived an actual income
of P186,681,023.28; P238,896,261.64; P254,332,037.87; P319,547,495.38;
and P374,526,560.25 or an increase of P52,215,138.36 (27.97%) in 1997; P15,435,776.23 (6.46%) in 1998; P65,215,457.51 (25.64%) in 1999; and, P54,979,064.87 (17.21%) in 2000, respectively.
Likewise, the actual
expenditures for the same 5-year period was P188,122,787.77; P238,789,081.09;
P258,350,992.49; P305,824,607.52; and P364,259,842.39 or an increase of
P50,666,293.32 (26.93%) in 1997; P19,561,911.40 (8.19%) in 1998; P47,473,615.03
(18.38%) in 1999; and, P58,435,234.87 (19.11%) in 2000, respectively.
B. Consumer Price Index
The province's annual
average Consumer Price Index (CPI), (the statistical measure of changes in the
retail price of a fixed basket of goods and services purchased by the average
household) was 142.0 in March, 1999, but rose to 149.3 as of September, 2000
with an inflation rate of 8.5 percent. The purchasing power of peso was
equivalent to P0.67.
C. Family Income and
Expenditures
The annual average family
income of the province had a notable increase of 58.62 percent between 1994 and
1997. For the annual average family expenditures, the province had an increment
of 52.68 percent.
For 2002, more
families (23,697) fall under the annual income bracket of P30,000-P39,999 with
an average income of P35,242 per family. This constitute about 18.5% of the
total families as of 2002 wherein their average expenditure was higher than its
average income. Hence, it could not actually meet the nutritional requirements
for a simple Filipino family.
|
Total
Number of Families by Income Class (2002) |
Income
Class
(Peso) |
Total
No. of Families |
Income |
Expenditure |
Total
(in
P1,000) |
Average
(in
Peso) |
Total
(in
P1,000) |
Average
(in
Peso) |
|
SAMAR |
128,116 |
10,045,432 |
78,409 |
8,252,091 |
64,411 |
|
Under - 10,000 |
1,171 |
9,239 |
7,890 |
8,268 |
7,061 |
|
10,000-19,999 |
2,476 |
37,927 |
15,318 |
33,568 |
13,557 |
|
20,000-29,999 |
12,414 |
313,767 |
25,275 |
322,330 |
25,965 |
|
30,000-39,999 |
23,697 |
835,125 |
35,242 |
844,062 |
35,619 |
|
40,000-49,999 |
17,317 |
770,046 |
44,468 |
677,968 |
39,150 |
|
50,000-59,999 |
18,792 |
1,032,390 |
54,938 |
935,147 |
49,763 |
|
60,000-79,999 |
18,449 |
1,241,063 |
62,270 |
1,081,971 |
58,647 |
|
80,000-99,999 |
9,758 |
871,640 |
89,326 |
780,962 |
80,033 |
|
100,000-149,999 |
7,821 |
922,820 |
117,993 |
720,138 |
92,077 |
|
150,000-249,999 |
10,240 |
1,972,164 |
192,594 |
1,423,174 |
138,982 |
|
250,000-499,999 |
5,370 |
1,660,574 |
309,232 |
1,094,043 |
203,732 |
|
500,000 and over |
611 |
378,676 |
619,764 |
330,462 |
540,854 |
D. Poverty Incidence
The province poverty level
at 43.1 percent in 1994 as recorded by the National Statistics Coordination
Board, is second in the whole Eastern Visayas region. This constitutes an
absolute number of 45,615 households coming from the different basic
sectors-farmers, fisherfolks, workers in the informal and formal sectors,
disadvantaged women, the youth, the elderly, persons with disabilities and
victims of disasters and calamities.
|